How can (the myth of) infinite growth continue when our energy sources that drive growth are either leveling off or in decline? The cost of most goods and services are directly related to energy costs, so a decline in oil production translates to an increase in the costs of those goods and services. If oil production decreases dramatically, then many of those goods and services may become too inefficient to maintain availability. Here are excerpts from an article at peakoil.com that gives some insight into the situation:
More at: http://peakoil.com/production/peak-oil-the-clear-and-present-danger/
Global oil production (crude oil plus condensate) has been on a plateau / in decline for 7 years resulting in high energy prices that are feeding inflation, eroding family budgets and crippling the World economy. It is time for the international political community to awaken to the risks posed by Peak Oil. A British Government report published last week under a Freedom of Information Act (FOIA) request makes clear that civil servants working at the UK department of Energy and Climate Change (DECC) seem very aware of the risks posed by peak oil, and yet the British Government seems happy to continue to ignore warnings.
Last week The UK Guardian "newspaper" carried a story about an internal UK government report on peak oil that the government failed to make public and was eventually released under a Freedom of Information Act (FOIA) request made by French student Lionel Badal. The report, in form of a data and text rich Power Point presentation landed in my inbox (hat tip to Jerome) and I was quite amazed by the content. Slide 16 in particular caught my attention:
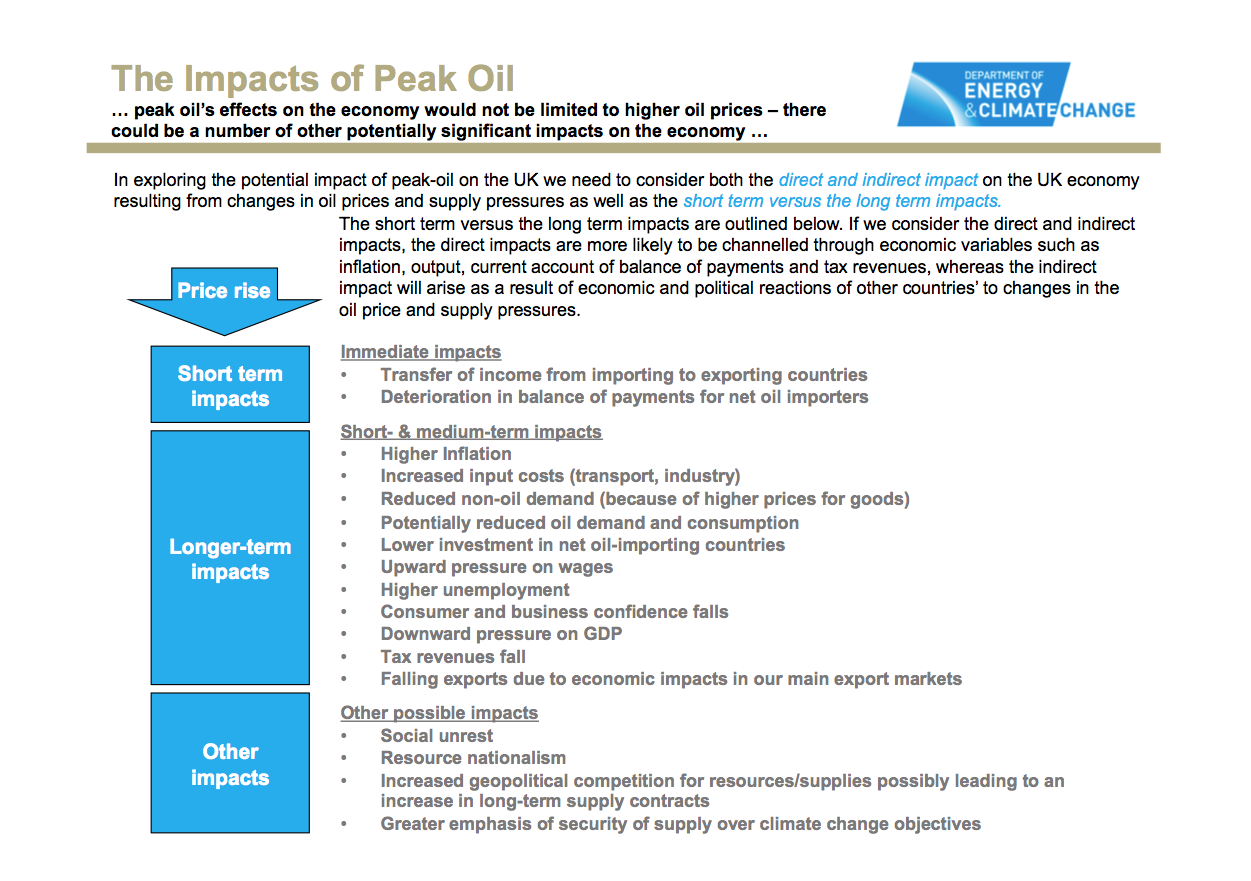
Dinosaurs never believe you when you tell them that their extinction is imminent.Of the 17 bullet points on the slide 16 have come to pass in the UK and in the neighbouring countries of Europe (click on slide to enlarge and open in separate window). Given that the research was conducted in 2007 and the report compiled in 2009 this conveys amazing insight by the DECC civil servants. Many may argue for different causes for the peak oil symptoms listed by DECC. But given the length of the list, near perfect correlation between forecast and events and the fact that global oil production has not increased for seven years, is it not safe to now draw the conclusion that peak oil lies at the heart of the UK and global economic woes?
Two important items are missing from the list and when these are taken on board the story is complete.
Methodology and observations
There are four main agencies reporting on global oil production:
1. The Energy Information Agency (EIA) in Washington that is a US Government agency.
2. The International Energy Agency (IEA) in Paris that is an OECD agency.
3. The BP statistical review of world energy, produced by BP, the UK based international oil company
4. The Joint Oil Data Initiative (JODI) that is a voluntary form of NGO.
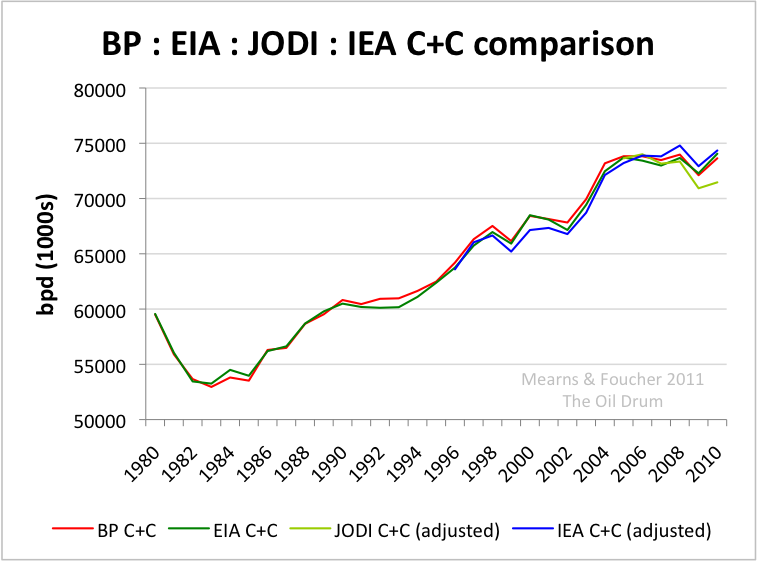
These agencies may gather information in different ways and they also report data in different ways using different categories and definitions of oil. The EIA reports monthly production data for crude oil + condensate (C+C) that includes synthetic crude oil produced from tar sands in Canada and Venezuela for all countries and giving a world total. JODI also reports C+C but only for 90 countries accounting for around 90% of global production. In the first post in this mini series, Dr Sam Foucher filled in the missing countries from the JODI data using EIA data giving an adjusted JODI proxy for global production that may then be compared with the EIA global total. BP report annualised average daily production data for C+C+NGL (natural gas liquids) and these data are not directly comparable to C+C reported by EIA and JODI. TOD commenter KLR deducted NGL data reported by the EIA from the BP data to get a BP proxy for C+C that is plotted in the chart up top.
Key Observations
The two previous posts in this series here and here examined the divergence between the EIA and JODI data since 2009 (see chart). Introducing BP and IEA data to the mix shows good agreement with the EIA and may tend to argue that these three sources provide the most reliable data. However, it may be the case that the EIA, BP and IEA are obtaining their data from the same source which remains unknown but rumored to be IHS. The source of JODI data is known to be direct reporting by national governments to JODI and it remains intriguing that the JODI data, which are based on government statistics, are diverging from the rest. The latest JODI production data reported for March 2011 shows production below 70 mmbpd. That is 6 mmbpd below the equivalent IEA data.
A production plateau was reached in 2004. The JODI data suggest that production may now be in decline whilst the EIA, BP and IEA data suggest that production remains on the range bound plateau. The difference here is really immaterial since high energy prices post 2007 caused by a failure to raise production to meet demand are traumatising the global economy.
The Oil Drum
More at: http://peakoil.com/production/peak-oil-the-clear-and-present-danger/
No comments:
Post a Comment